Unit I
Macroeconomics Vs. Microeconomics
-Macroeconomics: The study of the economy as a whole.
“Looking at the big picture”
- Inflation, international trade, and wages
- Microeconomics: The study of individual or specific units of the economy.
“Looking at the trees but not the forest”
- Supplied and demand, Market structure: monopoly, competition
- Business organization: corporations
· Positive Economics Vs. Normative Economics
- Positive Economics: Attempts to describe the world as is.
“Fact based”
- It is very descriptive.
- It thrives on "what is"
- Collects and presents facts
- Example: Oil dropped in price from $3.00 to $2.00 in the past month.
- Example: Oil dropped in price from $3.00 to $2.00 in the past month.
- Normative Economics: Attempts to describe the world should be.
“Opinion based”
- The national minimum wage should be raised.
· Needs Vs. Wants
- Needs: Basic requirements for survival.
- Example: food, shelter, water, and clothing
- Wants: Desires of citizens.
“You don’t need it but you still want it”
· Goods Vs. Services
- Goods: tangible commodities.
“Something you can feel or touch”
-Capital goods: Items used in the creation of other goods.
-Example: tires, windows on a car, etc.
-Consumer goods: Goods that are intended for final use by the consumer.
- Services: Work that is performed for someone.
-Example: restaurant, barber shop, etc.
· Scarcity Vs. Shortage
- Scarcity: The most fundamental economic problem that all societies face.
- How to satisfy unlimited wants with limited resources.
-Example: Oil
- Shortage: Quantity demanded is greater than the quantity supply.
· Factors of Production:
1. Capital: 2 types(Human and Physical)
- Human capital: Knowledge, skills, abilities, and talents that are gained through education and work experience.
- Physical capital: Tools, machines, and robots.
2. Entrepreneurship (innovative risk taker)
3. Land: natural resources
4. Labor: The work force 
· Trade Off: Alternatives that we give up when we choice one course of action over another.
· Opportunity Cost: Next best alternative

- 4 Assumptions
- Two goods
- Fixed resources(land, labor, capital, and entrepreneurship)
- Fixed technology
- Full employment of resources
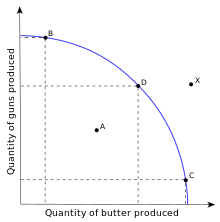
-Attainable but inefficient
-UnderutilizationPoints B, C, and D: On the curve
-Attainable and efficientPoint X: Outside the curve
-Unattainable3 Types of Movement that occur within the PPC:
1. Inside the Curve
-Occurs when resources are underemployed or unemployed.
2. Along the PPC
3. Shifts of the PPCWhat causes the PPC/PPT to shift?
1. Technological changes
2. Economic growth
3. Change in resources
4. Change in the labor force
5. Natural diseases/war/famine
6. More education and training(human capital)
Elastic demand: Very sensitive to a change in price, (E>1), product is not a necessity, and there are available substitutes.
- Examples: Soda, steaks, candy, and fur-coats.
- Examples: Gas, salt, milk, insulin, medicine, and toothpaste.
Price Elasticity of Demand(PED):
- Step 1: Quantity=(New quantity-old quantity)/old quantity
- Step 2: Price=(New price-old price)/old price
- Step 3: % change in quantity demanded/ % change in price
Total Revenue: The total amount of money a firm receives from selling goods and services.
Marginal Cost: Cost producing one more unit of a good.
Formulas:
- Price * Quantity = Total Revenue
- Rent, mortgage, insurance, and salaries.
Marginal Cost: Cost producing one more unit of a good.
Formulas:
- TFC + TVC = TC
- AFC + AVC = ATC
- TFC / Q = AFC
- TVC / Q = AVC
- TC / Q = ATC
- TFC = AFC * Q
- TVC = AVC * Q
- MC = NTC-OTC
Demand: The quantities that people are willing and able to buy at various prices.
 Supply: The quantities that producers or sellers are willing and able to produce at various prices.
- The Law of Demand: States there is an inverse relationship between price and quantity demanded (As price decreases, quantity decreases) and (As price decreases, quantity increases).
- A "change in quantity demanded" is caused by a change in price.
- A "change in demand" is caused by
- Change in buyer's taste (advertisement)
- Change in the # of buyers (population)
- Change in income (normal goods and inferior goods)
- Change in the price of related goods (complementary goods and substitute goods)
- Change in expectations
- The Law of Supply: States there is a direct relationship between price and quantity supplied (As price increases, quantity increases) and (As prices decreases, quantity decreases).
- A "change in quantity supplied" causes a change in supply.
- A "change in supply" is caused by
- Change in weather
- Change in the # of suppliers/sellers
- Change in technology
- Change in taxes or subsidies
- Change in the costs of production
- Change in expectations
Supply Curve Shifts to the Left:
- Increase in cost of production
- Decrease in technology
- Increase in taxes
- Decrease in subsidies
- Decrease in # of sellers
- Decrease in weather
Supply Curve Shifts to the Right:
- Decrease in cost of production
- Increase in technology
- Decrease in taxes
- Increase in subsidies
- Increase in # of sellers
- Increase in weather
Equilibrium: The point at which the supply curve and the demand curve intersect. At this point, all resources are being efficiently used.
- Excess demand occurs when the quantity demanded is greater than the quantity supplied. This will result in shortages, where consumers cannot get the quantities of items that they desire.
- Price ceiling creates a shortage. A price ceiling occurs when the government puts a legal limit on how high the price of a product can be. In order for a price ceiling to be effective, it must be set below equilibrium. For example, the government sets a price ceiling on flu shots and shots are sold for less than what they are worth; therefore creating a shortage of flu shots.
- Ex: Rent control (New York & San Francisco)
- Excess supply occurs when the quantity supplied is greater than he quantity demanded. This will result in a surplus, where producers have inventories they cannot get rid of.
- Price floor is the lowest legal price a commodity can be sold at. A price floor creates a surplus. Price floors are used by the government to prevent prices from being too low. The most common price floor is the minimum wage.
Business Cycle Terms:
- Peak: Highest point of real GDP.
- Greatest amount of spending and lowest amount of unemployment.
- Inflation becomes a problem in this phase.
- Expansion(Recovery Phase): Real GDP is increasing due to an increase in spending and a decrease in unemployment.
- Contraction/Recession: Real GDP declines for six months due to a reduction in spending and increasing unemployment.
- Trough: Lowest point of real GDP.
- Least amount of spending and highest unemployment.
No comments:
Post a Comment